
Reportable segments
Group revenue in FY14, at £939.7m, was up 7.9%.
Halfords Group operates through two reportable business segments:
- Halfords Retail, operating in both the UK and Republic of Ireland; and
- Halfords Autocentres, operating solely in the UK.
All references to Group represent the consolidation of the Halfords ("Halfords Retail"/"Retail") and Halfords Autocentres ("Halfords Autocentres"/"Autocentres") trading entities.
The FY14 accounting period represents trading for the 52 weeks to 28 March 2014 ("the year"). The comparative period FY13 represents trading for the 52 weeks to 29 March 2013 ("the prior year"). All items in this report are shown before non-recurring items unless otherwise stated.
Financial results
| FY14
£m | FY13
£m | Change |
|---|
| Group Revenue | 939.7 | 871.3 | +7.9% |
| Group Gross Profit | 504.2 | 477.1 | +5.7% |
| Group EBIT* | 77.8 | 78.1 | -0.4% |
| Group EBITDA** | 101.1 | 103.4 | -2.3% |
| Net Finance Costs | (5.0) | (6.1) | -18.0% |
| Profit Before Tax and non-recurring items | 72.8 | 72.0 | +1.1% |
| Profit Before Tax, after non-recurring items | 72.6 | 71.0 | +2.3% |
* EBIT denotes earnings before net finance costs, tax and non-recurring items
** EBITDA denotes earnings before net finance costs, tax, depreciation, amortisation and non-recurring items
Cycling LFL revenues were up 19.4% reflecting improved execution AND sustained interest in Cycling as a leisure activity.
Group revenue in FY14, at £939.7m, was up 7.9% and comprised Retail revenue of £803.1m and Autocentres revenue of £136.6m. This compared to FY13 Group revenue of £871.3m, which comprised Retail revenue of £745.5m and Autocentres revenue of £125.8m. Group gross profit at £504.2m (FY13: £477.1m) represented 53.7% of Group revenue (FY13: 54.8%), reflecting a decrease in the Retail gross margin of 144 basis points ("bps") to 51.8% and an increase in the Autocentres gross margin of 78 bps to 64.4%.
Cycling LFL revenues were up 19.4% reflecting improved execution, sustained interest in Cycling as a leisure activity
Total Operating Costs before non-recurring items increased to £426.4m (FY13: £399.0m) of which Retail represented £341.0m (FY13: £323.4m), Autocentres £83.7m (FY13: £73.8m) and unallocated costs £1.7m (FY13: £1.8m). Unallocated costs represent amortisation charges in respect of intangible assets acquired through business combinations (the acquisition of Nationwide Autocentres Ltd in February 2010), which arise on consolidation of the Group.
Group EBITDA fell 2.3% to £101.1m (FY13: £103.4m), whilst net finance costs were £5.0m (FY13: £6.1m).
Group Profit Before Tax and non-recurring items for the year was up 1.1% at £72.8m (FY13: £72.0m).
Net non-recurring expenses of £0.2m (2013: £1.0m) during the year represented asset impairment costs of £0.4m to support the Stores Fit To Shop initiative and non-recurring income of £0.2m from the partial release of the Focus lease guarantee provision, recognised as a non-recurring cost in FY11, resulting from better than anticipated settlements.
Group Profit Before Tax in the year after non-recurring items was £72.6m (FY13: £71.0m).
Halfords Retail
| FY14
£m | FY13
£m | Change |
|---|
| Revenue | 803.1 | 745.5 | +7.7% |
| Gross Profit | 416.2 | 397.0 | +4.8% |
| Gross Margin | 51.8% | 53.3% | -144bps |
| Operating Costs | (341.0) | (323.4) | -5.4% |
| EBIT before non-recurring items | 75.2 | 73.6 | +2.2% |
| Non-recurring expense | (0.2) | (1.0) | -80.0% |
| EBIT after non-recurring items | 75.0 | 72.6 | +3.3% |
| EBITDA before non-recurring items | 93.6 | 94.6 | -1.1% |
Revenue for the Retail business of £803.1m reflected, on a constant-currency basis, a like-for-like ("LFL") sales increase of 7.6%. Non-LFL stores contributed £3.5m revenue in the year, with total revenue increasing 7.7%.
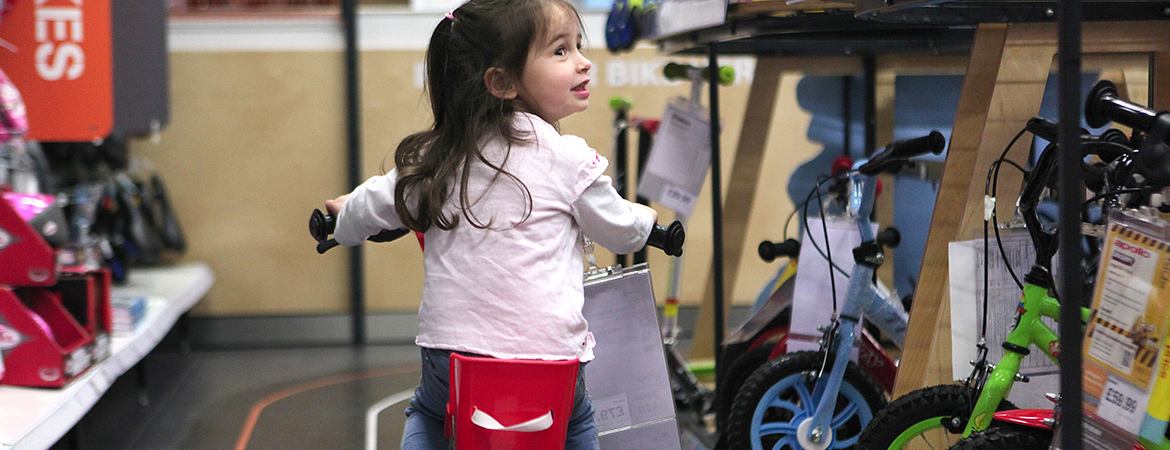
Cycling LFL revenues were up 19.4% reflecting improved execution, sustained interest in Cycling as a leisure activity, a successful Christmas for children's bikes, cycle-range refreshes and the benefit of focused marketing, driving strong premium-bike and accessory sales; Cycle Repair LFL revenues increased by 28.6%. The category also benefitted from favourable weather conditions compared to the prior year.
Car Maintenance LFL revenues sales increased by 4.9% in the year supported by the strong momentum in the fitting and sale of bulbs, blades and batteries ("3Bs"). Mild-winter weather conditions impacted demand for winter maintenance products and 3Bs, although the number of 3B fits was up 11.5% in the year with 3B-fitting revenues making up 49.6% of total in-store service income.
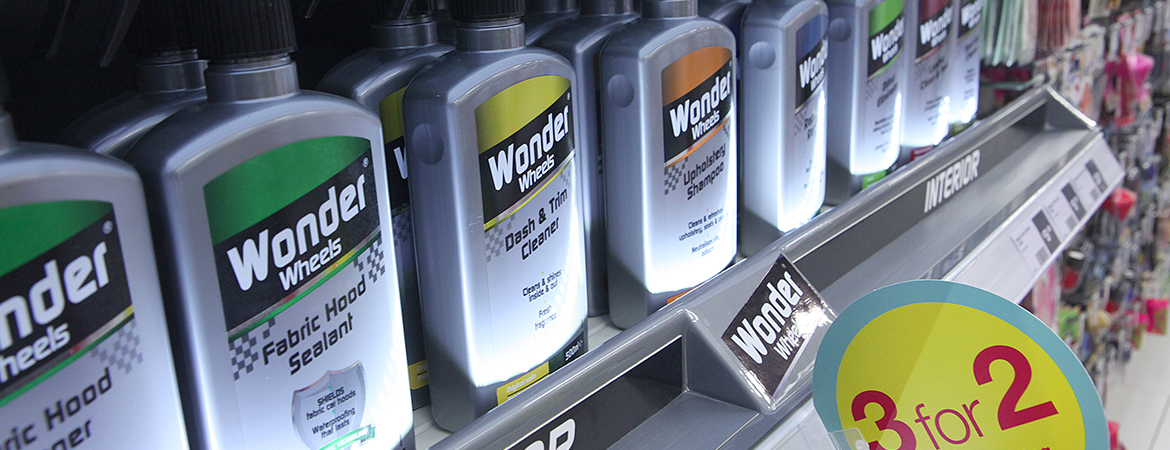
Car Enhancement LFL revenues were down 0.1%. Car Cleaning sales were up 13.8% supported by better merchandising to emphasise the strength of the Halfords branded offer. Audio continued to grow, this time by 1.1%. Although the Sat Nav category remained challenged, with sales down 8.1%, Halfords' value share in the 12 months to March was maintained.
Travel Solutions LFL revenues increased by 2.1%, with enhanced-clearance activity and more-compelling offers driving improved sales of camping and travel equipment.
Revenues for the Retail business are split by category below.
| FY14
(%) | FY13
(%) |
|---|
| Cycling | 32.8 | 29.6 |
| Car Maintenance | 31.8 | 32.6 |
| Car Enhancement | 23.1 | 24.9 |
| Travel Solutions | 12.3 | 12.9 |
| Total | 100.0 | 100.0 |
Gross profit for the Retail business at £416.2m (FY13: £397.0m) represented 51.8% of sales, 144 bps down on the prior year (FY13: 53.3%), in line with guidance. Higher sales volumes in lower-margin premium bikes, the launch of third-party branded Cycling parts, accessories and clothing ("PACs"), along with the impact of a mild winter on the higher-margin Car Maintenance category drove the reduction in margin, as did a more aggressive clearance and promotional approach across the categories.
Gross profit for the Retail business at £416.2m (FY13: £397.0m)
Management anticipates a 25-75 bps decrease in Retail gross margin in FY15, primarily reflecting the mix effect emanating from the disproportionate
strength of the lower-margin Cycling category. The decline is also a result of a switch of various cycle supplies to Halfords from duty-free Cambodia to Vietnam. This move has been designed to assure supply, given ongoing and increasing levels of significant industrial action in Cambodia. The demand for cash-accretive, margin-dilutive products such as PACs and flat wiper blades will continue whilst management will focus on the pricing of the Halfords wiper-blade offer as well as dozens of key-value-indicator products.
Operating Costs before non-recurring items were £341.0m (FY13: £323.4m), up 5.4% on the prior year and in line with guidance. The breakdown is set out below:
| FY14
£m | FY13
£m | Change |
|---|
| Store Staffing | 92.4 | 85.1 | +8.6% |
| Store Occupancy | 139.7 | 140.1 | -0.3% |
| Warehouse & Distribution | 33.7 | 28.5 | +18.2% |
| Support Costs | 75.2 | 69.7 | +7.9% |
| Total Operating Costs before non-recurring items | 341.0 | 323.4 | +5.4% |
Strong trading volumes led to incremental investment in store hours and increased incentive payments. These, plus the uplift in national minimum wages contributed to the increase in Store Staffing costs by 8.6%. The impact of the 3-Gears training programme on Store Staffing costs this year was immaterial. With an increase in minimum weekly-contracted hours, the number of Retail colleagues fell by around 1,000 during the year to around 9,000, although there was a material increase in the number of full-time equivalent colleagues.
Store Occupancy costs decreased by 0.3% year on year. Inflationary increases in utilities and investment in store repairs were offset by continued savings from rent negotiations and surrender payments, plus depreciation, given the profile of the store portfolio.
Warehouse & Distribution costs increased by 18.2% driven by the surge in store and, in particular, online volumes, as well as increases in transport and utility costs. A number of service-focused trials were executed during the year, including out-of-hours deliveries and more-frequent store deliveries. The cut-off time in relation to the online Click & Collect proposition recently moved from 3pm the day before to 6pm.
Support Costs rose by 7.9%. This reflected increased activity associated with the change programmes Click with the Digital Future and 21st Century Infrastructure as well as the launch of both the extended PACs range and the enhanced Retail website. The increase also reflected the up-weighted marketing investment to support higher sales volumes. Increases in payroll costs, reflecting the annualisation of headcount increases in FY13 and the strengthening of the senior management team were offset by savings in recruitment costs following the move to bring recruitment of store colleagues in-house. Given the performance of the business over the period, incremental colleague incentive payments were accrued for payment.
Management anticipates a 4-5% increase in Retail operating costs in FY15. A significant proportion of this increase is dependent on volumes/performance. Major investments will include Store Labour costs associated with potential increased volumes as well the pay award as part of the 3-Gears training programme. Increased volumes have the potential to inflate Warehouse & Distribution costs and depreciation is set to increase, given the material uplift in capital expenditure versus prior periods. One-off operating cost investments in c.50 refreshed stores in FY15 will also be notable.
Gross profit for the Retail business at £416.2m (FY13: £397.0m).
Halfords autocentres
| FY14
£m | FY13
£m | Change |
|---|
| Revenue | 136.6 | 125.8 | +8.6% |
| Gross Profit | 88.0 | 80.1 | +9.7% |
| Gross Margin | 64.4% | 63.7% | +78 bps |
| Operating Costs | (83.7) | (73.8) | +13.4% |
| EBIT | 4.3 | 6.3 | -31.7% |
| EBITDA | 7.5 | 8.8 | -14.8% |
Engaging and fun place to shop in refreshed stores.
There were no non-recurring items related to the Autocentres business in either year presented.
Autocentres generated total revenues of £136.6m (FY13: £125.8m), an increase of 8.6% on the prior year with a LFL revenue decline of 0.1%. This performance reflected the operational and market challenges faced by the business. LFL tyre revenues increased by 4.7% and represented 16.0% of total LFL revenues. Online-booking revenues in the year grew 43.7% versus the prior period.
Gross profit at £88.0m (FY13: £80.1m) represented a gross margin of 64.4% against a prior-year margin of 63.7% driven by reduced reliance on affiliate-driven tyre sales and stronger core Service, MOT and Repair margins, underpinned by consistent improvements in parts buying.
Autocentres' EBIT was down 31.7% at £4.3m (FY13 £6.3m) as a result of revenue growth outweighed by operating costs and the investments made for future growth. Operating costs increased due to the centre-opening programme together with the ongoing expansion of the support structure. Halfords is committed to the continued investment in the Autocentres business to secure medium-term growth, though the business plans to slow down the centre-opening programme from the prevailing 20–30 new centres per year to 10–15 in the medium term by opening fewer, larger centres.
On the basis of an anticipated material uplift in LFL sales, management anticipates Autocentres' EBITDA to increase in FY15.
Portfolio management
The Retail store portfolio at the end of the year comprised 465 stores (end of FY13: 466).
The following table outlines the changes in the Retail store portfolio over the year:
| Number | Stores |
|---|
| Relocated | 2 | Newport , Weston-Super-Mare |
| Re-gears | 13 | South Shields, Telford, Wakefield, Trowbridge, Dewsbury, Doncaster, Oldham, Edinburgh (Leith), Waterlooville, Stoke (Fenton), Grantham, Torquay, Bangor |
| Downsizes | 4 | Cardiff (Newport Road), Cannock, Chadwell Heath, Eastbourne |
| Openings | 1 | Sky headquarters (Osterley) |
| Closed | 2 | Felixstowe, Glasgow Shettlestone |
A number of further rightsizes and relocations will be completed in due course, including Altrincham, Bedford, Perth, Workington and Thanet (Margate).
The group portfolio at the end of the year comprised 465 stores and 303 autocentres
23 new Autocentres were opened and three (Croydon, Preston and Ilford) were closed in the year, taking the total number of Autocentre locations to 303 as at 28 March 2014.
With the exception of nine long leasehold and two freehold properties within Autocentres, the Group's operating sites are occupied under operating leases, the majority of which are on standard lease terms, typically with a 5 to 15-year term at inception and with an average lease length of c.8 years.
The group portfolio at the end of the year comprised 465 stores and 303 autocentres
Net non-recurring expenses
The following table outlines the components of the non-recurring expenses incurred in the year:
| FY14
£m | FY13
£m |
|---|
| Onerous lease charges | — | (1.2) |
| Asset impairment charges | (0.4) | (0.8) |
| Release of Focus lease-guarantee provision | 0.2 | 1.0 |
| Net non-recurring expenses | (0.2) | (1.0) |
£0.4m of assets from certain stores were impaired in the year as a result of the investment in the Stores Fit To Shop initiative (FY13: £0.8m).
In FY11, an exceptional charge of £7.5m was recognised in respect of a provision for property leases to which Halfords was a guarantor, triggered by the demise of the Focus DIY retail chain. At 28 March 2014 the provision was £0.2m, reflecting the settlement of a number of leases and utilisation for on-going rent, insurance and service charges. Whilst there were on-going associated rental costs, there was a release of £0.2m of the provision in the year. £0.2m of this provision remained as at 28 March 2014 and is anticipated to be utilised in FY15.
Capital investment in the year totalled £30.4m (FY13: £18.8m)
Finance expense
The net finance expense for the year was £5.0m (FY13: £6.1m). The expense includes £0.2m of accelerated amortisation of issue costs in the current year following completion of debt facility refinancing in September 2013. The new, reduced revolving credit facility expires in November 2017. An element of the net finance expense also relates to the crystallisation of a number of prior-year tax computations in the year.
Management anticipates a decline in the FY15 finance expense versus FY14.
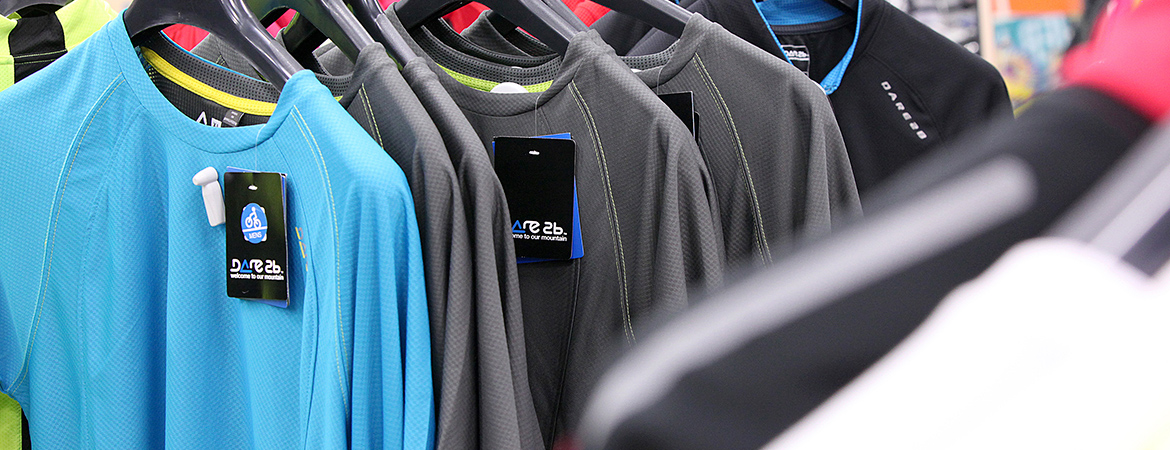
Improving clothing offer.
Taxation
The taxation charge on profit for the financial year was £17.1m (FY13: £18.3m), including a £0.1m charge (FY13: £0.1m) in respect of tax on non-recurring items. The full-year effective tax rate of 23.5% (FY13: 25.7%) was higher than the UK corporation tax rate (23.0%) principally due to the non-deductibility of depreciation charged on capital expenditure and other permanent differences arising in the year.
A number of prior-year outstanding tax computations were settled during the year and accounted for a £21.0m cash outflow (being tax plus interest). The outstanding tax positions had been provided for in prior periods with the provisions being utilised against the tax payments.
Management anticipates an effective tax rate of 21–22% in FY15 and no one-off tax payments.
Earnings per share ("EPS")
Basic EPS before non-recurring items was 28.8 pence (FY13: 27.7 pence), a 4.0% increase on the comparable year. Basic EPS after non-recurring items was 28.6 pence (FY13: 27.2 pence). Basic weighted-average shares in issue during the year were 194.0m (FY13: 194.3m).
Dividend
The Board has recommended a final dividend of 9.1 pence per share (FY13: 9.1 pence), taking the full-year dividend to 14.3 pence per share. If approved, the final dividend will be paid on 1 August 2014 to shareholders on the register at the close of business on 4 July 2014. In the light of the guidance given twelve months ago, the Board will now look to maintain a c.2x dividend cover over the medium term, growing full-year dividends broadly in line with earnings per share. Given the operating cash flow profile of the business the Board also anticipates the ratio of future interim and final dividend payments to move toward 30:70.
Improved Retail presentation.
Capital expenditure
Capital investment in the year totalled £30.4m (FY13: £18.8m) comprising £24.4m in Retail and £6.0m in Autocentres. Consistent with prior years, management adopted a prudent approach with regard to capital investment and focused on investments generating material returns in line with the Getting Into Gear strategy.
Within Retail, £13.9m (FY13: £5.8m) was invested in stores, including 23 store refreshes. The investment also reflected refresh-based relocations and right-size activity as well as general capital spend relating to store roofing, flooring and security. By the end of FY14, 27 stores were trading in the refreshed format in line with the Stores Fit To Shop initiative. Additional investments in Retail infrastructure included a £9.7m investment in IT systems, such as development of the online Retail proposition and an upgrade of the core SAP operating system. The Support Centre also attracted a small element of refresh investment.
Within Autocentres a further £6.0m (FY13: £5.6m) was invested to drive the centre roll-out plan and upgrade centre equipment, especially in relation to the delivery of the tyre–fitting proposition. Expenditure was directed to improve other infrastructure elements, from a refreshed website to more-efficient IT processing systems, enabling more effective customer-focused centre management.
Management continues to anticipate an investment of around £100m in Retail capital expenditure in the three-year period to the end of FY16. Timing of investments such as the SAP upgrade reflected the shortfall in the FY14 expenditure versus guidance. FY15 Retail capital expenditure is anticipated to amount to c.£35m. Autocentres' capital expenditure in FY15 is anticipated to be c.£8m, the increase reflecting incremental investment in property and equipment, diagnostics and IT systems.
Inventories
Group inventory held at the year end was £150.2m (FY13: £133.2m), in line with guidance; the increase was primarily Cycling-related. Stock continued to be managed tightly and the planned levels of additional Retail stock increased on-shelf availability to 98.3%. Autocentres inventory was £1.4m (FY13: £1.3m). The Autocentres business model is such that only modest levels of inventory are held within the centres, with most parts being acquired on an as-needed basis.
Capital investment in the year totalled £30.4M (fy13: £18.8M).
Cashflow and borrowings
The Group continued its track record of robust cash generation. Cash generated from operating activities in the year was £67.5m (FY13: £93.5m). After taxation, capital expenditure and net finance costs, free cashflow of £39.5m (FY13: £71.8m) was generated. The reduced cashflow performance reflected the upweighted levels of capital and inventory investment in the year and also included the settlement of £21.0m of prior-year outstanding tax computations.
Group net debt of £99.6m (FY13 £110.6m) represented a decline of 9.9% with a non-lease-adjusted 12-month net debt: EBITDA ratio of 1.0:1 versus 1.1:1 in the prior year. A new £200m revolving credit facility was secured in the year, expiring in November 2017.
Principal risks and uncertainties
The Board considers risk assessment, identification of mitigating actions and internal control to be fundamental to achieving Halfords' strategic corporate objectives. In the Annual Report & Accounts the Board sets out what it considers to be the principal commercial and financial risks to achieving the Group's objectives. The main areas of potential risk and uncertainty in the balance of the financial year are described in note 19 to the Annual Report and Accounts. Other risks that might impact the achievement of Halfords strategic corporate objectives are detailed in Risks and Uncertainties and include:
- Economic risks
- Business strategy risks
- Competitive risks
- Compliance
- Changing customer preferences
- Reliance on foreign manufacturers
- Product and service quality
- Information technology systems and infrastructure
- Dependence on key management personnel
Specific risks associated with performance include Christmas trading as well as weather-sensitive sales, particularly within the Car Maintenance and Cycling categories in the Retail business.
Andrew Findlay
Chief Financial Officer
21 May 2014
Strong brands add credibility to cycling proposition.